HFT Stuttgart

GIS Studio (2017)

The GIS Studio Module follows a project approach, which promotes research oriented group work and aims at an in-depth understanding of challenging issues. A variety of studio projects is offered as electives to the students. The topics stem from the field of advanced Geoinformatics. Students work together in small groups in a studio atmosphere with the aim to master a problem and solve it together. To promote independent and self-organised work of the students the contribution of the lecturer is limited to a small number of contact hours. The project approach promotes research oriented group work. The research work of a studio project typically consists of several phases: analysis of the problem and literature survey, development of a possible solution, poster presentation and defence of the proposed solution, implementation, experimental investigation and report writing, and finally the presentation of the project. In 2017, the topics were as follows:

Smart Pollen

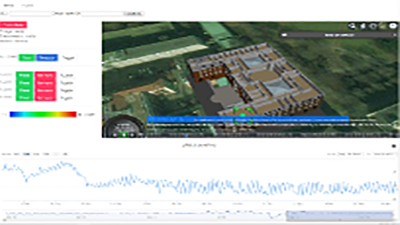
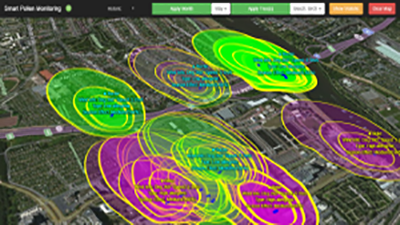
Smart Pollen “Smart Pollen Monitoring” is a simple and yet powerful 3D-web-based application project designed especially for people with pollen allergies. It facilitates a visualization of trees with the analyzed areas of the pollen dispersion in the city area. It illustrates the real-time and past behavior of pollen dispersion at a specific location from each tree directly. It analyzes the area of high pollen dispersion dynamically according to the tree location, tree type and wind information by the period of time. Additionally, it is possible for users to enter the new tree data which is not yet included in the application database, so users can contribute to update the performance of the application over time. Overall, it aims to help people with tree pollen allergies to make the right decision about all their activities, for example to select the right place for living or to plan the route to travel which has low level of pollen dispersion

Read more...

Visualization of Time Series in Cesium

Visualization of Time Series in Cesium The amount of spatial-temporal data produced has risen in the recent years with the advent of Internet of Things (IoT) devices. Spatial-temporal datasets include the time and geographical dimensions in addition to other attributes. IoT systems comprise of connected objects like sensors that collect data from different points in space. The location information may either come from stationary or moving sensors and should be represented in a standard format in data models. The sensors include weather stations, cameras, space imaging devices. Because of the large amounts of data collected by these sensors, visualization tools and techniques should be employed to effectively display the data in a meaningful way. In this project, visualization of temperature data of rooms in HFT's Building 1 using data obtained from sensors in the different rooms is done using SensorThings API and Cesium.

Read more...

Sustainable Development Goal Indicators

Presentation of information, ideas and concepts demands interactivity and dynamic visualization. With the emergence of latest web standards, programming languages and server-side technology, the static presentations are no more appealing nowadays. The current project is a blend of modern web standards, data driven documents, database, web maps and server technology to visualize Sustainable Development Goal Indicators (SDGI). D3 was designed to fill up the pressing needs for web accessible and sophisticated data visualization. It provides developers with the ability to create rich interactive and animated contents based on the data.

Read more...

Topographic Web Map of Mountainous Areas

Topographic Web Map of Mountainous Areas Open Street Map is considered a prominent example of volunteer geographic information (VGI). The community works based on collecting data from volunteer work and updating the database regularly. It is one of the largest opensource and free data providers in the world. There are many ways in which the data from Open Street Map can be used. This paper presents one of them: building a tile server which will render tiles, in order to make beautiful maps. The studied area is Romania and we will concentrate on the mountainous regions of the country, by introducing hillshading and contour lines to the tiles.

Read more...
<