HFT Stuttgart

Visualization of Time Series in Cesium

1. Introduction

1.1. Background

The amount of spatial-temporal data produced has risen in the recent years with the advent of Internet of Things (IoT) devices. Spatial-temporal datasets include the time and geographical dimensions in addition to other attributes. IoT systems comprise of connected objects like sensors that collect data from different points in space. The location information may either come from stationary or moving sensors and should be represented in a standard format in data models. The sensors include weather stations, cameras, space imaging devices. Because of the large amounts of data collected by these sensors, visualization tools and techniques should be employed to effectively display the data in a meaningful way.

To access information about sensors, data from sensors and comparison of information from different sensors, standardization is required. To address this, the Open Geospatial Consortium (OGC) came up with Sensor Web Enablement (SWE) standards. SWE standards enable sensors and their data repositories accessible, discoverable and useable via the internet. With this standardization, data from different sensors can be combined and compared as well as integrated in other applications implementing other OGC standards. (The OGC's Sensor Web Enablement (SWE) Initiative, 2017)

In this project, visualization of temperature data of rooms in HFT's Building 1 using data obtained from sensors in the different rooms is done using SensorThings API and Cesium. The objectives include:

  1. Implement SensorThings API, to store, manage and retrieve temperature sensor data.
  2. Use Cesium globe to visualize building 3D model for HFT Building 1.
  3. Use Cesium Language (CZML) to visualize the temporal dimension of the dataset.

1.2. Technologies

1.2.1. SensorThings API

SensorThings API is an OGC standard providing an open, geospatial-enabled and unified framework to interconnect the IoT devices, data, and applications over the Web. It is an open standard that utilizes proven and widely-adopted open standards including web protocols and SWE standards. It has two main functionalities which are handled by profiles: Sensing profile and Tasking profile. In the current version 1.0 of the API, only the sensing profile is implemented while the tasking profile is work in progress. The sensing profile provides a standard way to manage and retrieve observations and metadata from various IoT sensors and is based on OGC Observations and Measurements (O&M) Model.

The API is designed with resource-constrained IoT devices and web developers in mind. It is based on Representational state transfer (REST) principles, the JSON encoding, and URL conventions. It has defined entities which can be CREATE, READ, UPDATE, and DELETE with standard HTTP commands (POST, GET, PATCH, and DELETE). The entities include:
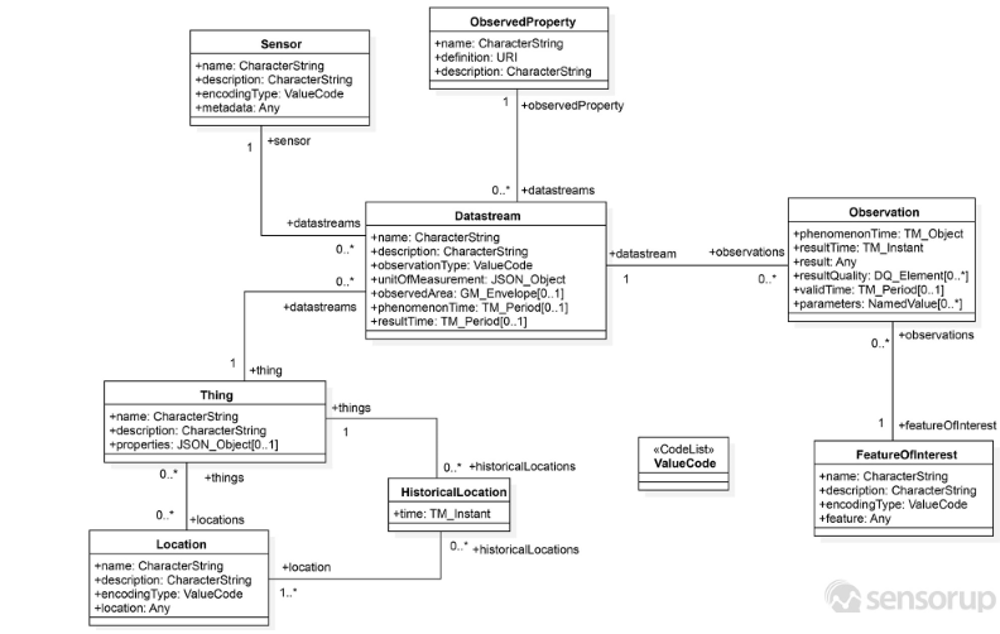
  1. Thing: A physical or virtual object that can be identified and integrated into a communication network, e.g. a weather station
  2. Locations: Locates one or many things e.g. a room
  3. HistoricalLocations: Contains current and previous locations of a thing
  4. Observation: Measured data values, e.g. temperature, humidity
  5. ObservedProperty: Specifies the Observation's properties, e.g. Degrees Centigrade
  6. DataStream: A collection of observations from a sensor
  7. Sensor: An instrument that records observations, e.g. a Thermometer
  8. FeatureOfInterest: the feature where a phenomenon is measured and observations recorded. e.g. a point in a room. (SensorThings API, 2017)
SensorThings API Data Model
Figure 1: SensorThings API Data Model. (OGC SensorThings API Documentation, 2017)

1.2.2. Cesium and CZML

Cesium is a JavaScript library for creating 3D globes and 2D maps in a browser without a plugin. It is open source, cross platform and tuned for dynamic data visualization. Cesium API allows for dynamic geospatial visualization supporting open data formats for terrain, imagery and vector data. CZML is a JSON format for describing a time-dynamic graphical scene in a web browser running Cesium. Geometric primitives and graphics can be described using CZML and their changes with time. It is open source but not yet adopted by OGC.

3D Building models of New York City displayed on Cesium globe
CZML used to display space satellites position over time

Figure 2: 3D Building models of New York City displayed on Cesium globe (left) and CZML used to display space satellites position over time (right). (Cesium Sandcastle, 2017)

2. Related research

2.1. OGC Sensor Observation Service (SOS)

Sensor Observation Service (SOS) is an OGC standard and part of the SWE framework that provides a standardized web interface for managing and retrieving metadata and observation from different sensor systems. It also defines means to add new sensors and remove existing ones. It uses OGC standards in the SWE framework; Sensor Model Language (SensorML) for sensors data description and O&M for measured values encoding. (Arne Bröring, 2012)

2.1.1. Comparison of SensorThings API and SOS

SensorThings API can interoperate with SOS at both the data and service interval levels as it is backward compatible with SOS. They are both based on OGC's O&M standard enabling interoperability. However, SOS cannot interoperate with SensorThings API at the service interface level as the latter offers more features and better flexibility. Table 1 below shows the technical differences between SOS and SensorThings API.

Table 1: Technical and functional differences between SensorThings API and SOS.
OGC SensorThings API OGC Sensor Observation Service (SOS)
Encoding JSON XML
Architectural Style Resource Oriented Architecture Service Oriented Architecture
Binding REST SOAP
Insert new Sensors and Observations HTTP POST SOS specific interface: RegisterSensor() and InsertObservation()
Deleting Existing Sensors HTTP DELETE SOS specific interface: DeleteSensor()
Pagination $top/$skip/$nextLink Not supported
Pub/Sub Support MQTT and SensorThings
MQTT Extension
Not supported
Updating Properties of Existing Sensors or Observations HTTP PATCH and JSON PATCH Not supported
Deleting Existing Observations HTTP DELETE Not supported
Linked Data Support JSON-LD Not supported

2.2. SensorThings API Implementations

Several free and open source SensorThings API implementations exist for use by developers.

Comparing the developer's experience between the two, SensorThings API offers a faster and cleaner description of entities in JSON compared to SOS's XML encoding. In Figure 3 below, a code snippet to create a FeatureOfInterest is shown.

Creating a FeatureOfInterest in SensorThings API
Figure 3: Creating a FeatureOfInterest in SensorThings API

2.2.1. Fraunhofer IOSB SensorThingsServer

This implementation was developed by Fraunhofer Institute for Optronics, Systems Engineering and Image Analysis (IOSB) and is the first certified open source implementation worldwide. This will be used for the project. (Linos, 2017)

2.2.2. Whiskers

SensorUp has deployed solutions based on SensorThings API in Emergency and Disaster management, integrated environmental monitoring, ground water monitoring, and, international Arctic monitoring.

2.2.3. GOST

This is an open source implementation of SensorThings API in the Go programming language by Geodan. PostgreSQL is used as the default sensor data database and a JavaScript client is used.

2.2.4. SensorThings HcDT Charting SDK

This is a JavaScript charting library for the SensorThings API based on the open source Highchart library and datatable. The front-end charting library enables developers to connect to DataStreams from any SensorThings API service and display it in charts, tables and dashboards in web applications. (SensorThings Highchart and Datatable, 2017)

2.2.5. Mozilla STA

Mozilla developed a node implementation of SensorThings API for their Project SensorWeb. The aim is to provide organizations and individuals with information from IoT devices and help them make daily life and policy choices. One of the areas is air quality monitoring to help people suffering from asthma and allergies or are concerned about their health. In Figure 4 below, a design of the cloud architecture of SensorWeb is shown. (SensorWeb, 2017)

SensorWeb cloud architecture
Figure 4: SensorWeb cloud architecture (SensorWeb, 2017)

2.3. Comparison of Cesium and Google Earth API

Google Earth is the most well-known digital global platform. It is a closed system with both free and paid versions. The application can be installed to be used on desktop, web and mobile but with no options to customize the interface. It offers a lot of functionality including; navigation, search, drawing and measuring, place marks and tours, 3D terrain and buildings, support for KML/KMZ and GPS data containing placemarks, vector data, raster overlays and 3D models, views of ocean, sky and planets, ability to adjust sunlight, print, share, overview map, fly throughs, historical aerial photography, street view. In Table 2 below are some of the major differences between Cesium and Google Earth API.

Table 2: Comparison of Cesium and Google Earth globes
Google Earth API Cesium
Ease of use Coding in JavaScript and CZML required to use Cesium
Uses Google basemaps only A variety of basemaps: OpenStreetMap, Bing, Google, ArcGIS, MapServer
Offers no customisation of the interface High potential for customization possible and plugins
A lot of resources to learn and use Google Earth Limited tutorials
Free and paid versions, closed system Free and open source system
Works only online Works online and offline

3. Solution

3.1. Data Preparation

3.1.1. 3D Building Model

The Building model for HFT’s building one was provided in X3D format. The building is provided in four X3D files representing the ground floor, 1st, 2nd and 3rd floors. The models are LOD4 providing the walkthrough ability. As Cesium uses glTF file format for 3D objects, the files had to undergo conversion.

The conversion process from X3D to glTF file formats
Figure 5: The conversion process from X3D to glTF file formats

In the first step, the X3D files were opened in Blender software to scale and apply rotation so that they fit their geographical location. This was necessary to have them orientated in the same direction as the building represented in maps and on the ground. This step could also be performed while placing the models in cesium but would require much time to arrive at the appropriate figures. The next step was to save the models in OBJ format for the next operation.

Cesium provides a tool running on NodeJS to convert OBJ to glTF formats. The tool requires the OBJ file as the input and the name of the output file in glTF extension.
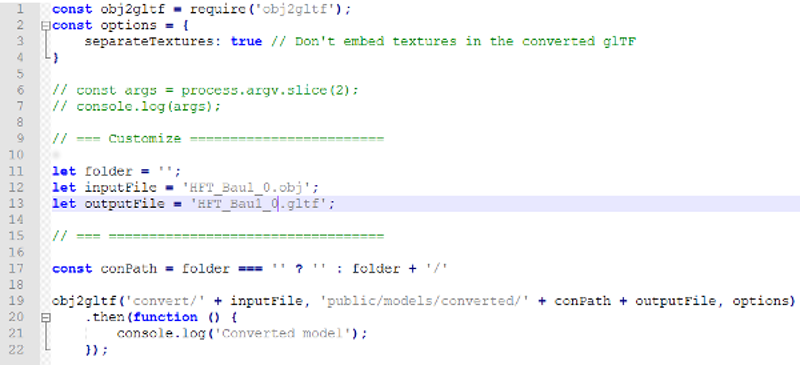
 A snippet of the OBJ2GLTF tool code (Cesium, 2017)
Figure 6: A snippet of the OBJ2GLTF tool code (Cesium, 2017)

3.1.2. Temperature Data

The temperature was provided in CSV format. The data covered the hourly temperature reading from 1st January 2016 to 30th November 2016 for all rooms recorded in building one. For this project, rooms; 011, 013, 020, 024, 028, 106, 108, 211 and 303 were chosen for visualization.

3.2. SensorThings API setup

The FraunhoferIOSB SensorThingsServer implementation of SensorThings API was used for the project. The source code for the web application and the installation instructions were provided in their GitHub repository. (Fraunhofer IOSB/ SensorThingsServer, 2017).

3.2.1. Database installation

The first step was to install the PostgreSQL database and create a database (sensorthings) for the project. The username and password were created for the database and a postgis extension was added to add spatial capabilities to the database.

The database configuration would be performed automatically by the SensorThingsServer files provided in the source code. To enable this, the server.xml and context.xml files were edited with the database name and login credentials.

3.2.2. Compiling

To run the web application two steps were necessary, to install a webserver and compile the application. Apache Tomcat Server was installed as required to run the web applications. To compile the web application, Maven was used to create a war file from the project’s source code root folder. The created war file was copied to the applications folder in Tomcat server ready for the next step.

3.2.3. Database Initialization

Using a web browser, the web application was opened for the first time which populated the created database with the necessary tables as required using this address .
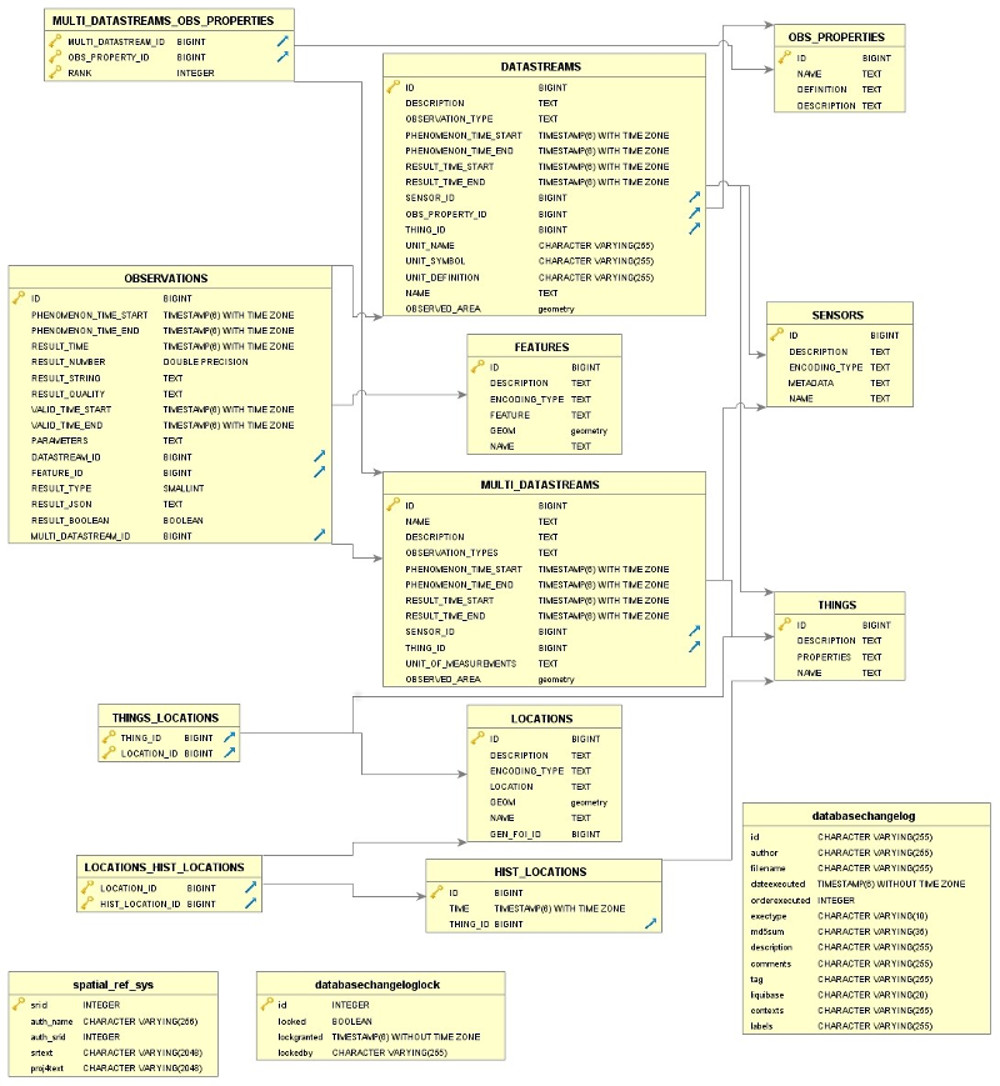
Entity relationship model of the database after initialization
Figure 7: Entity relationship model of the database after initialization

3.3. Cesium Setup

To use Cesium, the files provided in Cesium’s page were downloaded, extracted and placed in the web root folder. (Cesium Downloads, 2017).

3.4. Development

With the data prepared and the applications installed, the next step was creating a web application that would fulfil the objectives of the project. The structure of the project is shown below in Figure 8.
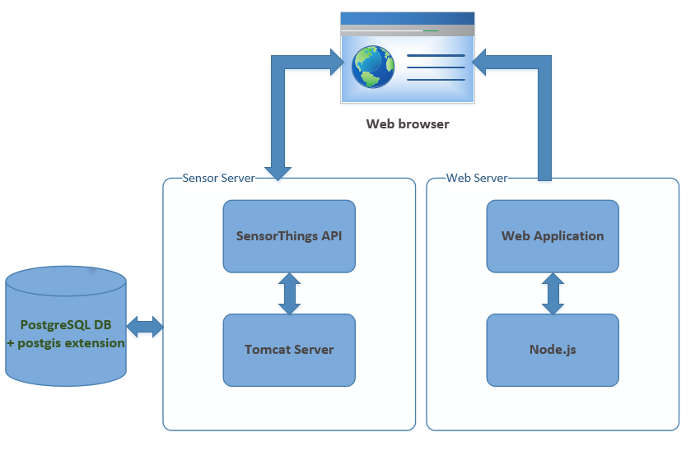
The system architecture
Figure 8: The system architecture

3.4.1. Add 3D models to Cesium globe

The glTF building models were added to the Cesium globe using the longitude and latitude to place the models according to the location on the ground per floor with varying height values. The interface was customized to include add, remove and toggle buttons to enable viewing of separate floors.
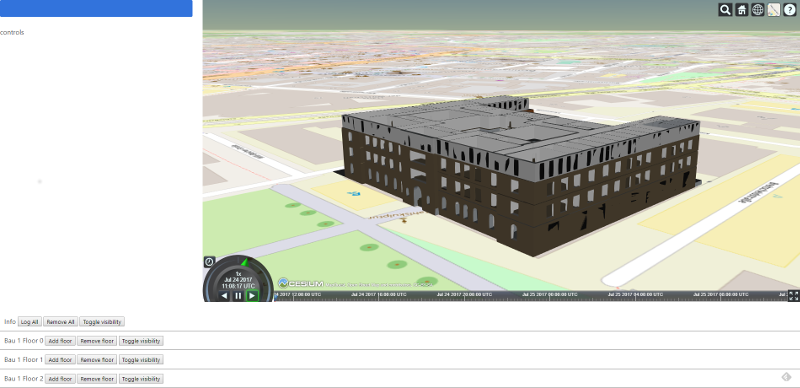
glTF models placed on Cesium globe using OpenStreetMap basemap
Figure 9: glTF models placed on Cesium globe using OpenStreetMap basemap

3.4.2. Load the temperature data

To load the temperature data to the database, the database model was considered to determine the structuring of the database.

Table 4: The SensorThings API entities matched to the temperature monitoring system data structure
SensorThings API Parameter
Sensors Temperature Sensors
Things Temperature Measurement Devices
ObservedProperty Temperature
Locations Rooms
FeatureOfInterest Feature Geometry (Point)
DataStream Sensor data
Observation Temperature data

The Thing was created manually containing Location, ObservedProperty, Sensor, DataStream for each thing and a file containing the temperature data (Timestamp, value) was imported to the respective DataStream using a CSV file import function created in JavaScript.

3.4.3. Draw Sensors

The sensors were added as glTF spheres to the 10 rooms chosen (011, 013, 020, 024, 028, 106, 108, 211 and 303) and placed in the rooms using Location coordinates in Cesium. They related to SensorThings API to fetch data for their respective DataStreams.

3.4.4. Create CZML

To connect the Cesium time-slider with a DataStream, CZML must be used. We generated a CZML file with data from SensorThings API to enable visualization of temporal dimension of the data.
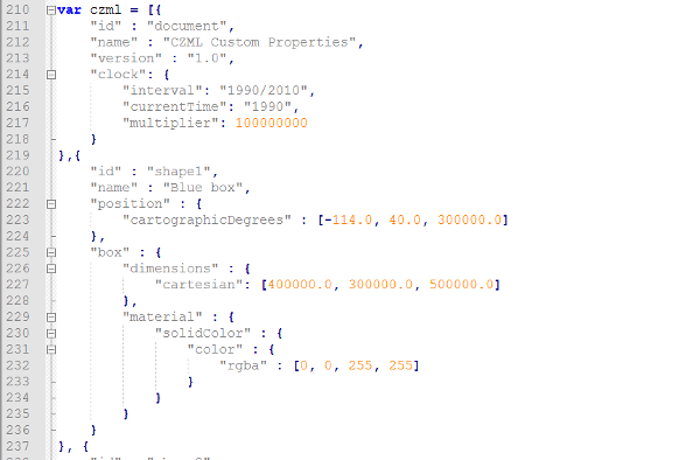
CZML structure for visualization
Figure 10: CZML structure for visualization

3.4.5. Create Charts

To visualize the temperature over a time, a Highchart JavaScript charting library was used to create a line series chart.

3.4.6. User Interface

The user interface of the web application was created to contain the 3D building model, sensor spheres displayed on Cesium globe and a chart showing the temperatures for the selected sensor. To visualize the temperature changes over time, the sphere size and color change according to the temperature values. The interface also allows the user to add, remove and toggle the different floors of building one to access the desired rooms and sensors. The page also contains a facility to import observations to a DataStream.
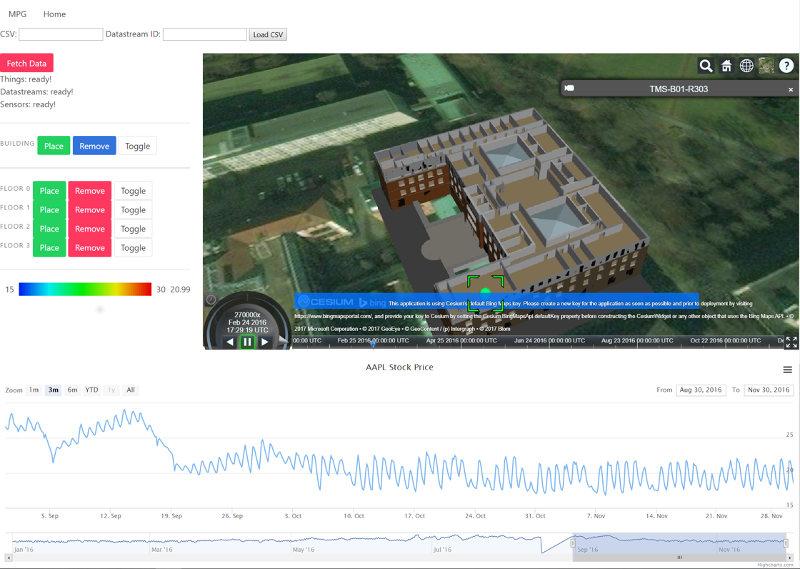
Web application user interface
Figure 11: Web application user interface

4. Summary

4.1. Extension possibilities

  1. Include real-time sensor data, more sensors e.g. humidity, and more buildings
  2. Link the time slider to the chart using CZML

4.2. Conclusion

  1. SensorThings API is easy to understand and use for sensor data collection and retrieval from different sources. It provides an easy, fast and clear setup for entities, recording of observations, update, delete and read using existing HTTP vocabulary.
  2. Cesium globe provides a good alternative to the proprietary globes for displaying of geographical data and 3D models with the capability to add the temporal dimension.
  3. Cesium globe is resource-hungry taking up much computing resources and power.

5. References

  • Arne Bröring, C. S. (2012). OGC Sensor Observation Service Interface Standard. Open Geospatial Consortium.
  • Cesium. (2017, July 20). Convert OBJ assets to glTF. Retrieved from GitHub
  • Cesium Downloads. (2017, July 21). Retrieved from Cesium
  • Cesium Sandcastle. (2017, July 20). Retrieved from Cesium - WebGL Virtual Globe and Map Engine
  • Eclipse Whiskers. (2017, July 21). Retrieved from Eclipse Foundation
  • Fraunhofer IOSB/ SensorThingsServer. (2017, July 21). Retrieved from GitHub
  • Liang, S. (2017, July 21). Comparison of SensorThings API and Sensor Observation Service. Retrieved from Sensorup
  • Linos, A. (2017, July 21). First open source implementation of the OGC Sensor Things API certified. Retrieved from Fraunhofer IOSB
  • OGC SensorThings API Documentation. (2017, July 20). Retrieved from SensorUp OGC SensorThings API Developer Centre
  • SensorThings API. (2017, July 20). Retrieved from Wikipedia
  • SensorThings Highchart and Datatable. (2017, July 21). Retrieved from SensorUp
  • SensorWeb. (2017, July 21). Retrieved from Mozilla Wiki
  • The OGC's Sensor Web Enablement (SWE) Initiative . (2017, July 20). Retrieved from Open Geospatial Consortium (OGC)